Project overview
Estimating the hidden shrub layer of forests from airborne LiDAR, within a fixed computing budget.
Why the understory matters
A forest fire spreads upward through layers of fuel. Surface fuel (dead leaves, grass and low plants) carries the fire along the ground; shrubs and small trees form a ladder between the ground and the tree crowns. Where that ladder is continuous, a surface fire can climb into the canopy and become a crown fire, which is far harder to control. The height and continuity of the understory are therefore among the most important inputs to fire-behaviour models.
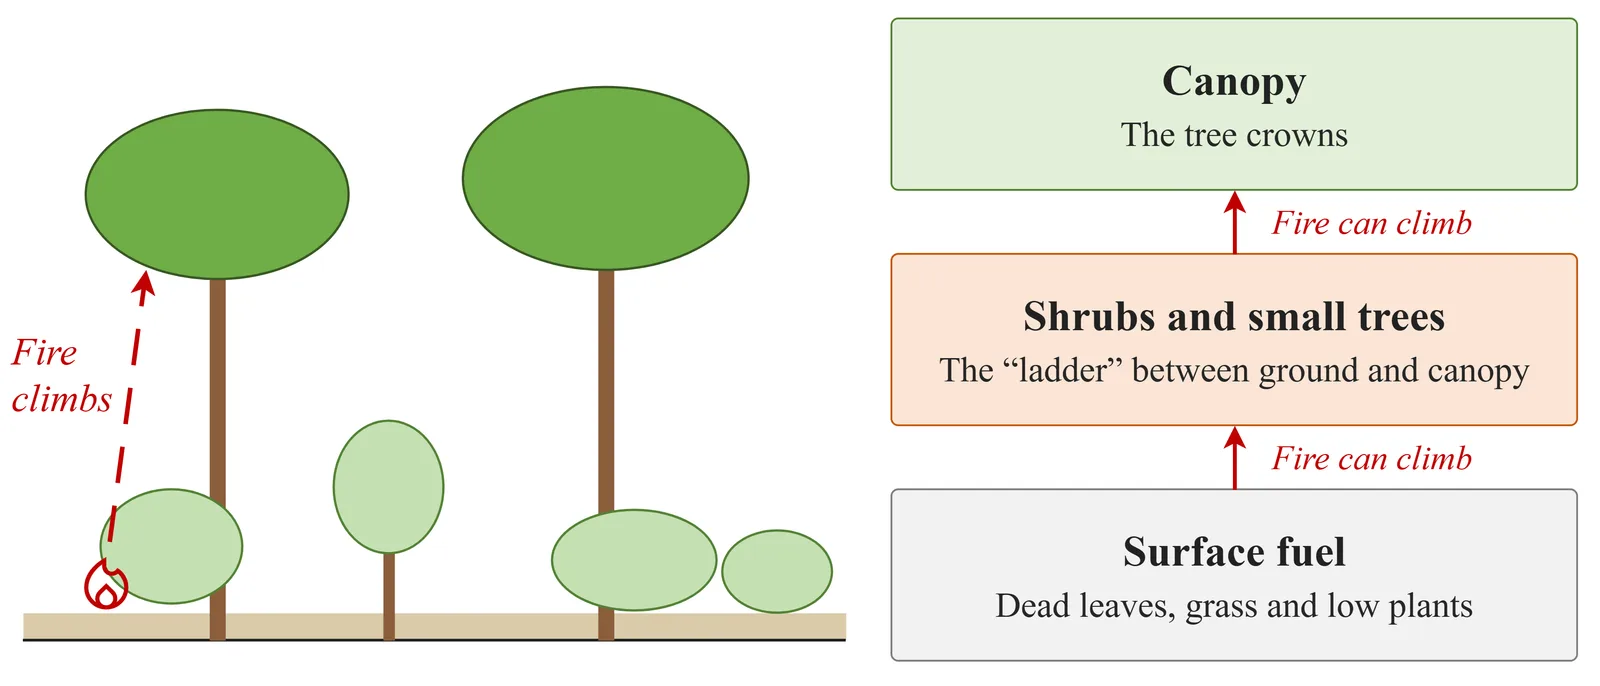 Figure 1. Vertical fuel layers. Shrubs and small trees form the ladder between surface fuel and the canopy.
Why it is hard to measure
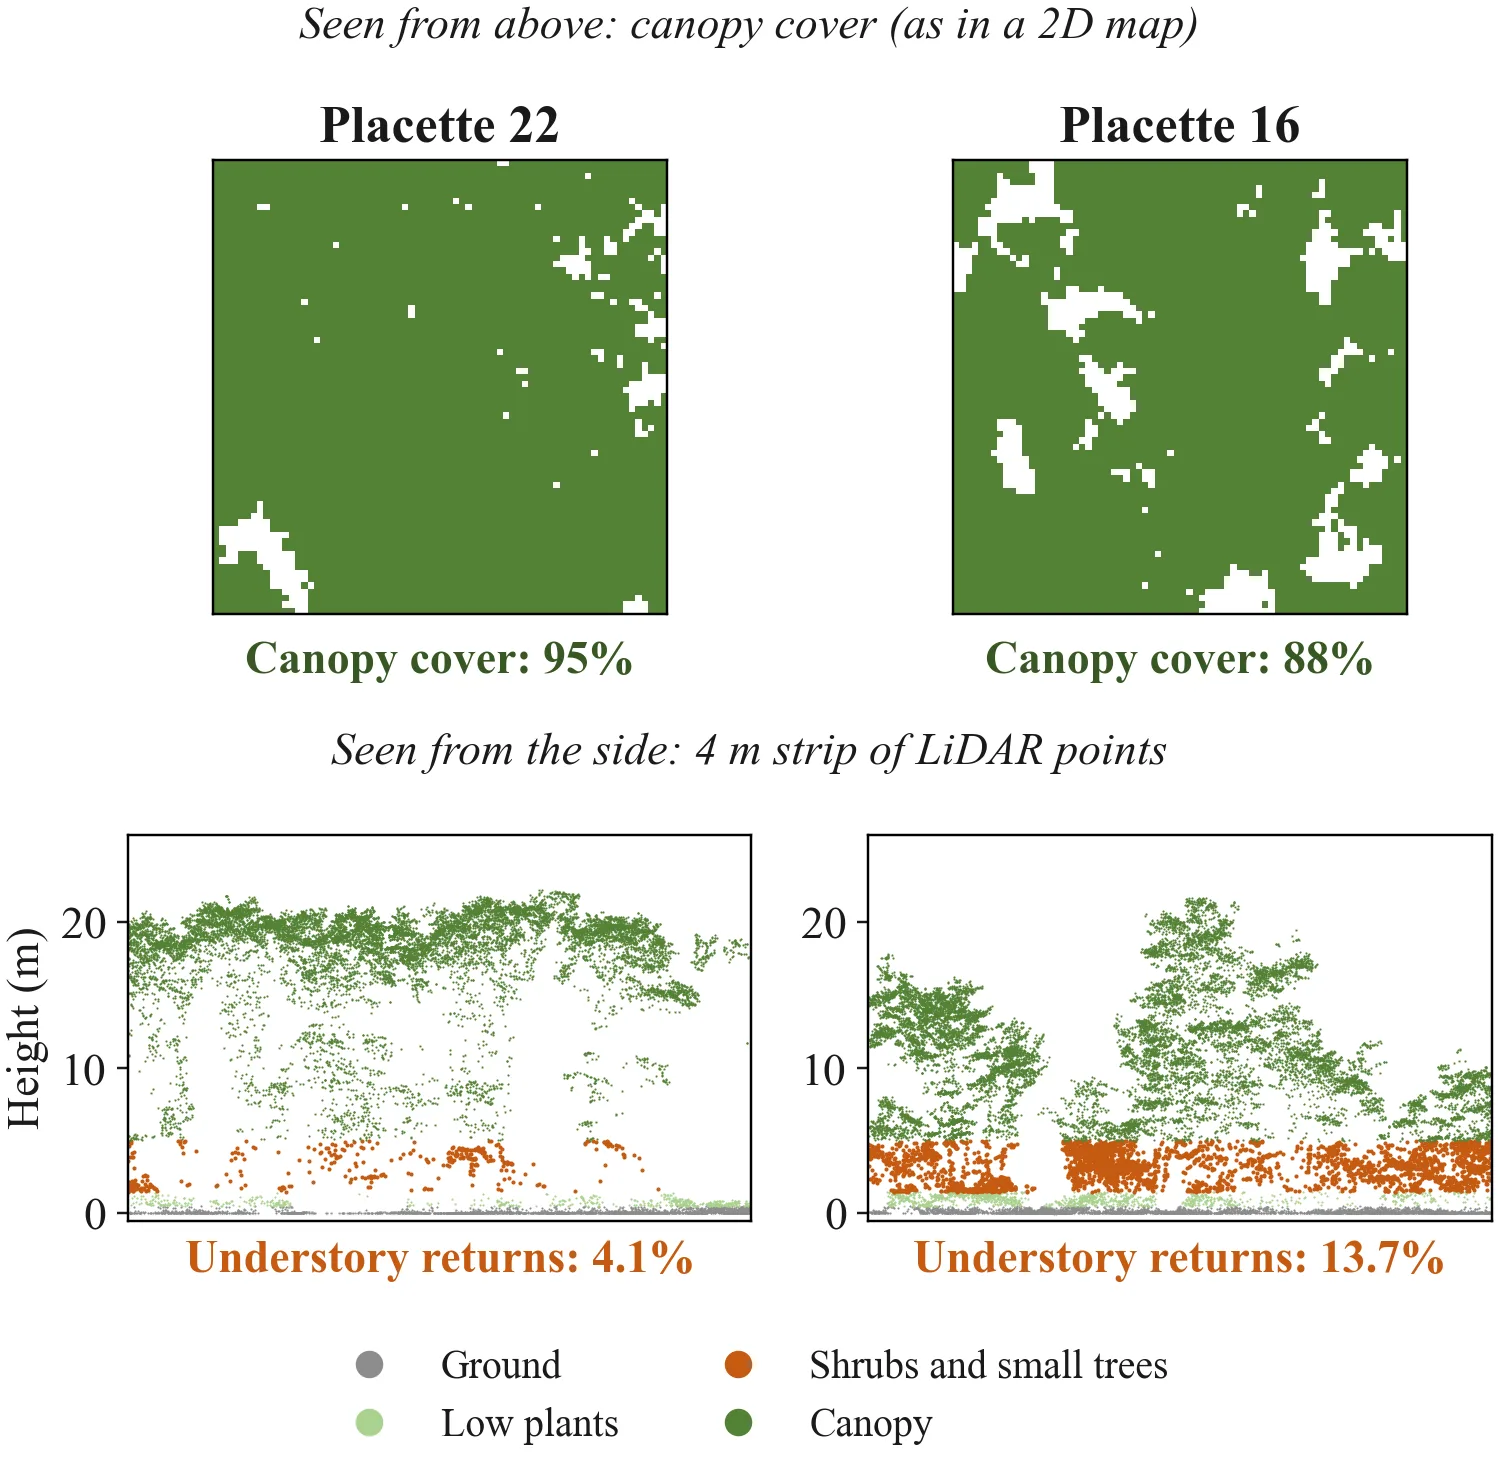
Maps made from above describe the canopy well and the understory poorly. Two plots with almost the same canopy cover can hold very different amounts of shrub fuel (figure at the top of this page). Airborne LiDAR records 3D points through gaps in the canopy, but fewer pulses reach the lower layers, and the scans are too large to process whole, so 3D pipelines keep only a sample of the points. Common sampling rules keep what was measured best, which removes the sparse understory first.
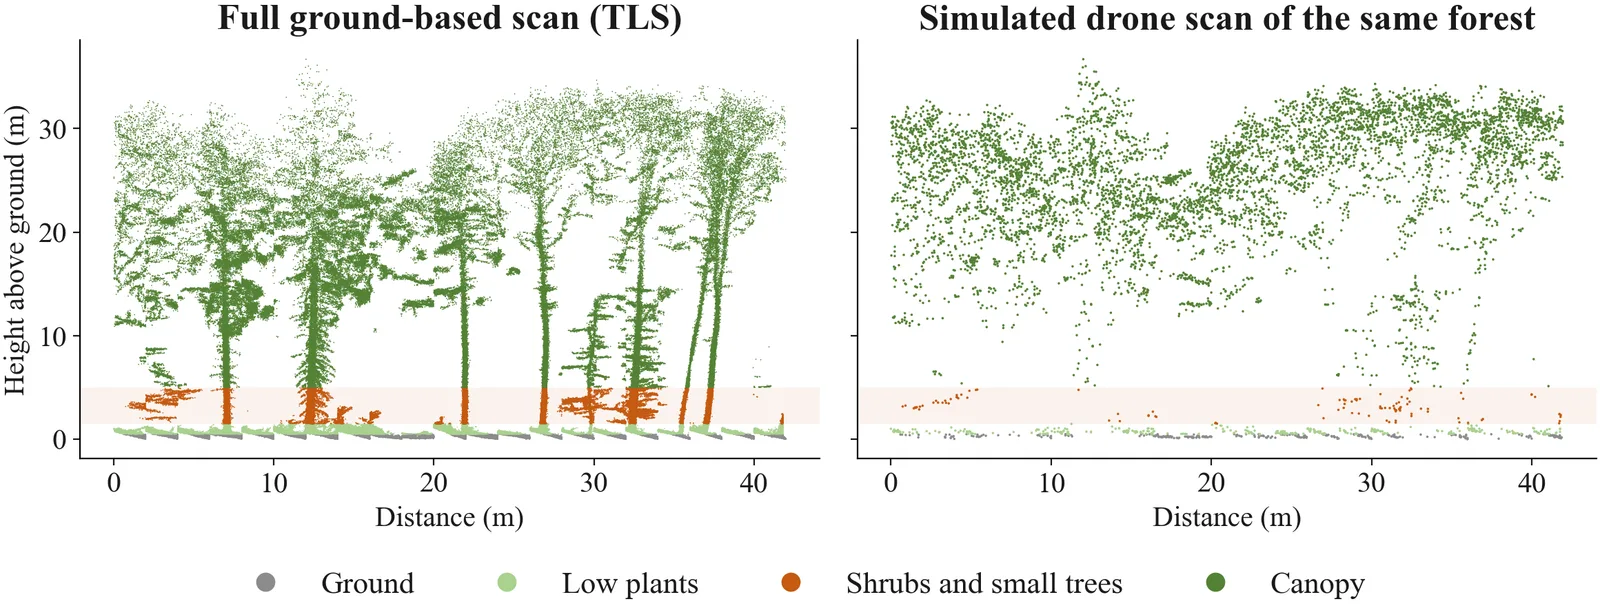 Figure 2. The same 42 m strip of forest from a public ground-based laser scan (LAUTx plot p14, handheld personal laser scanning, from the extended LAUTx scenes) and from a drone scan simulated from it with a simple attenuation model. Returns from shrubs and small trees (shaded band) almost disappear in the simulated scan.
Occlusion: what the sensor could and could not see
The absence of points is not evidence of absence. Space under airborne LiDAR falls into three states: occupied, where a return was recorded; observed empty, where pulses passed through without a return; and unobserved, where no pulse arrived. The project estimates these states from the scan geometry and reports never-observed space as undetermined, not as empty.
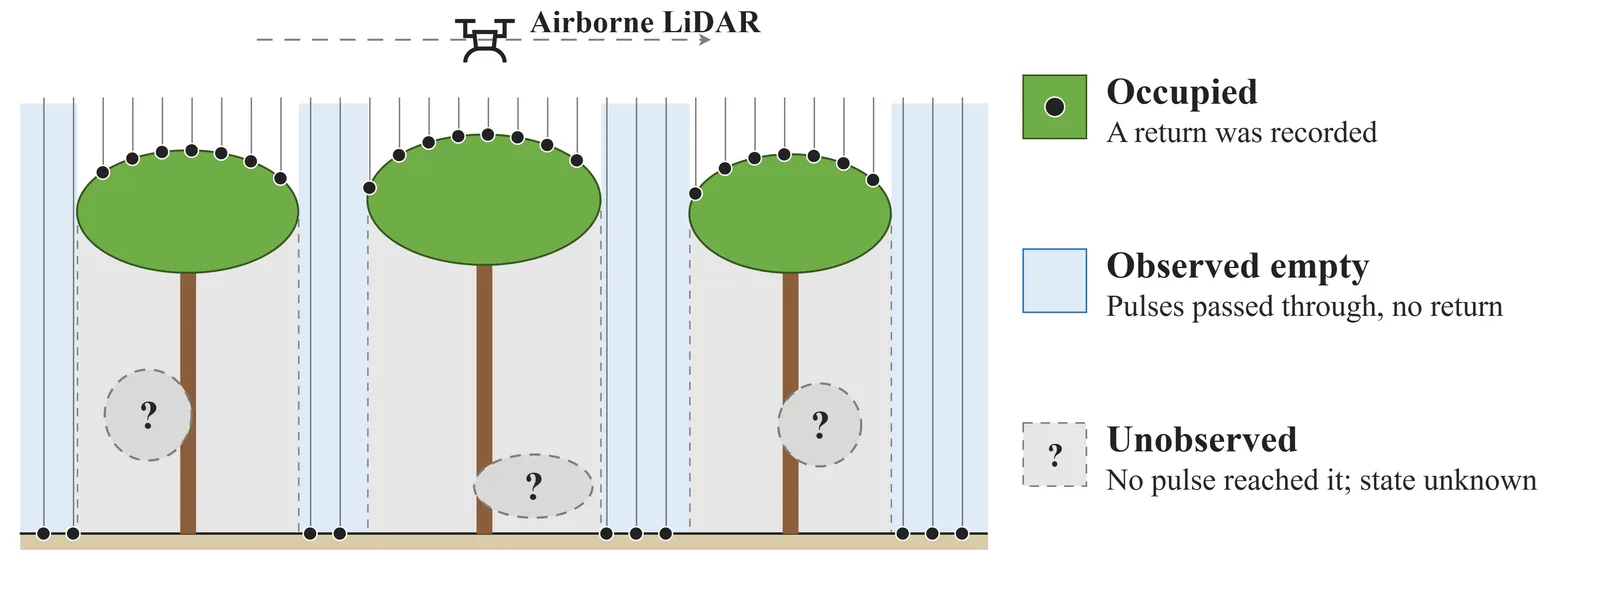 Figure 3. Occupied, observed empty and unobserved space under airborne LiDAR.
Approach
The method works within a fixed computing budget and spends it where information is missing. Every step is compared with simple methods at the same cost; height-stratified point selection is the main baseline.
- Point selection. Keep more points where evidence of the understory is scarce, instead of where the scan is already dense.
- Segmentation. Label every point and map the vegetation layers (PointNet++).
- Agent. Find regions that remain uncertain and request a second look within the same budget.
- Fuel structure. Convert the layer maps into the measures fire models use: understory top height, canopy base height and the ladder gap between them.
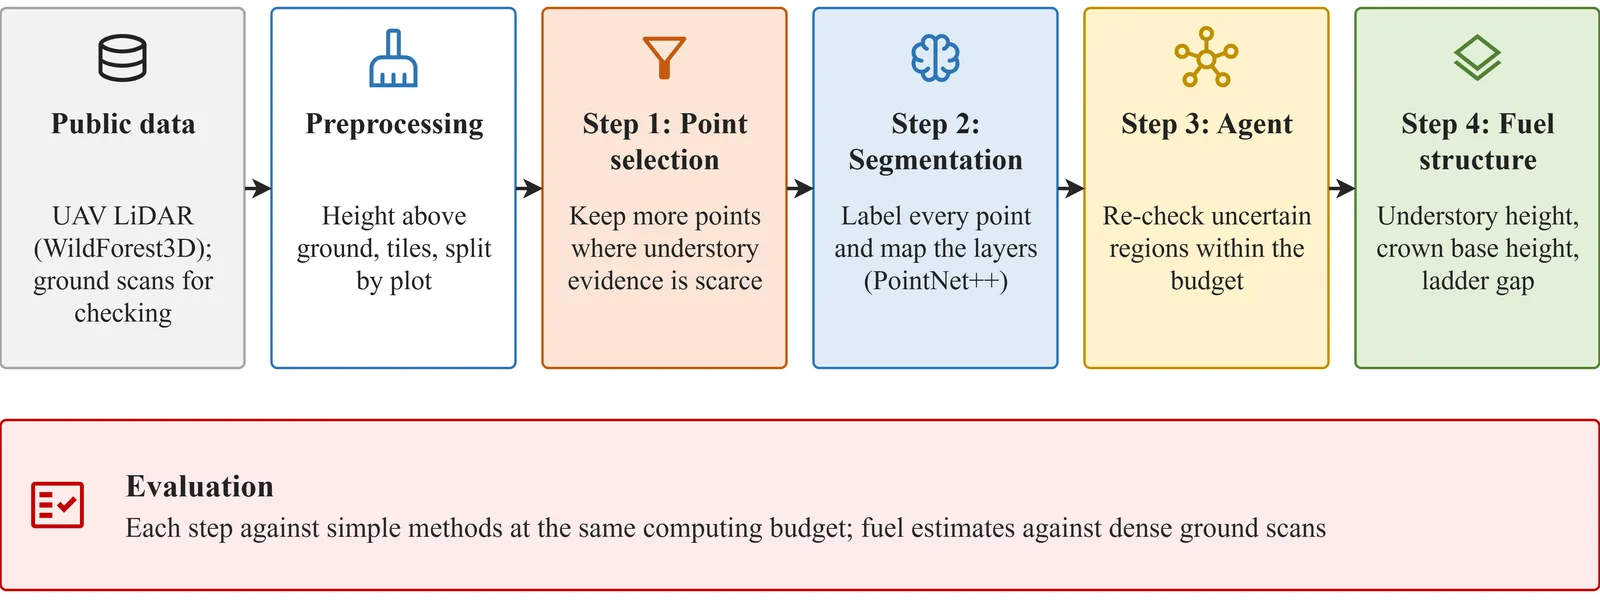 Figure 4. Workflow. Evaluation compares each step with simple methods at the same computing budget, and the fuel estimates with dense ground-based scans.
Data
The project uses public data only; no new field data are collected. UAV LiDAR from WildForest3D provides the main study plots and their reference layer maps. Labelled point clouds, such as FOR-instanceV2, show the ground, wood and leaf classes that segmentation models learn. Dense ground-based scans provide the references: handheld personal laser scanning from LAUTx and terrestrial laser scanning from Wytham Woods. The Datasets page lists every source with its licence.
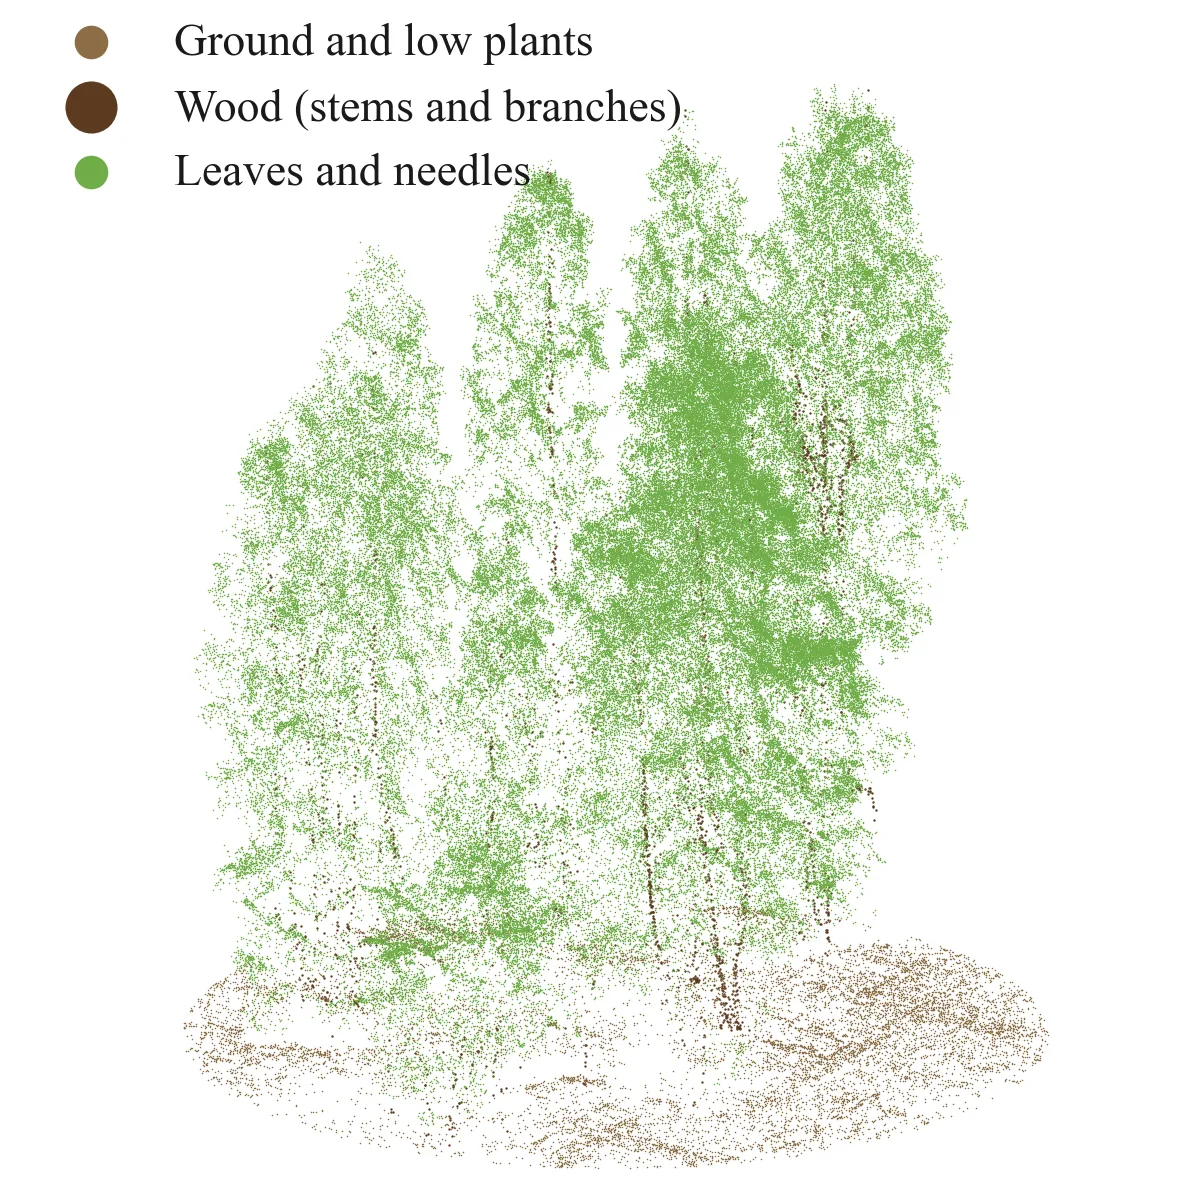 Figure 5. A FOR-instanceV2 plot (NIBIO2, plot 12) coloured by its reference labels.
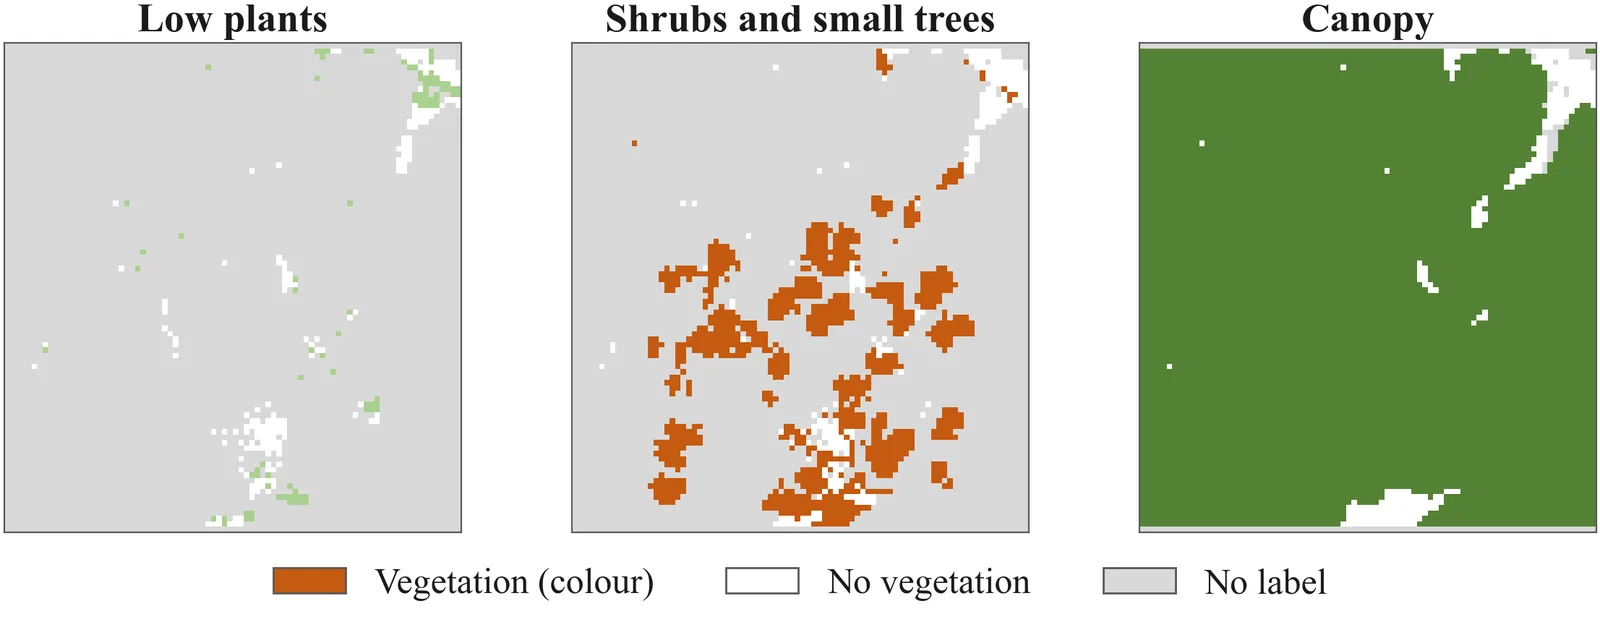 Figure 6. WildForest3D reference layer maps for one plot. Grey cells carry no label and are treated as unknown, not as empty vegetation.
Validation: hide and check
A dense public ground-based scan sees the understory clearly. A drone scan is simulated from it, in which the canopy hides the understory and the pulse directions are known. The system runs on the simulated scan, and its layers, heights and fuel measures are compared layer by layer with the same measures computed from every point of the full scan, including the poorly observed regions.
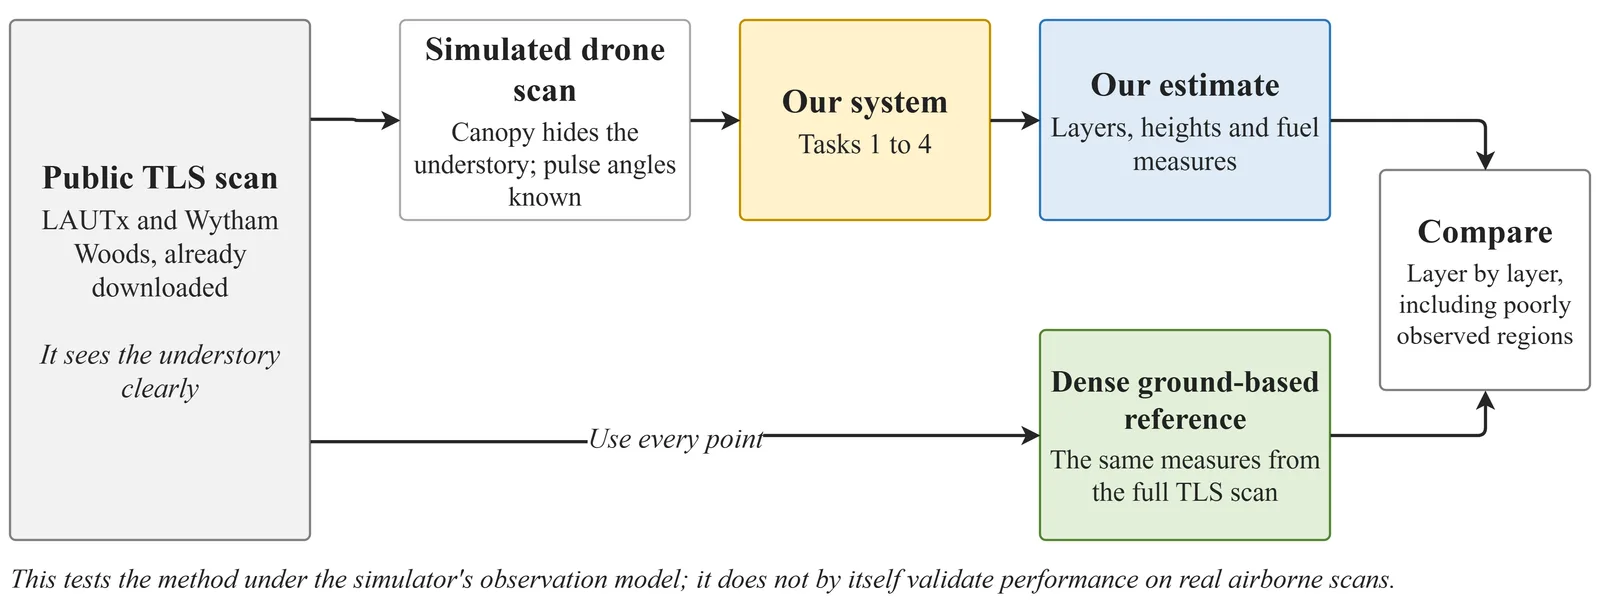 Figure 7. Hide-and-check validation. This tests the method under the simulator’s observation model; it does not by itself validate performance on real airborne scans.
Outputs
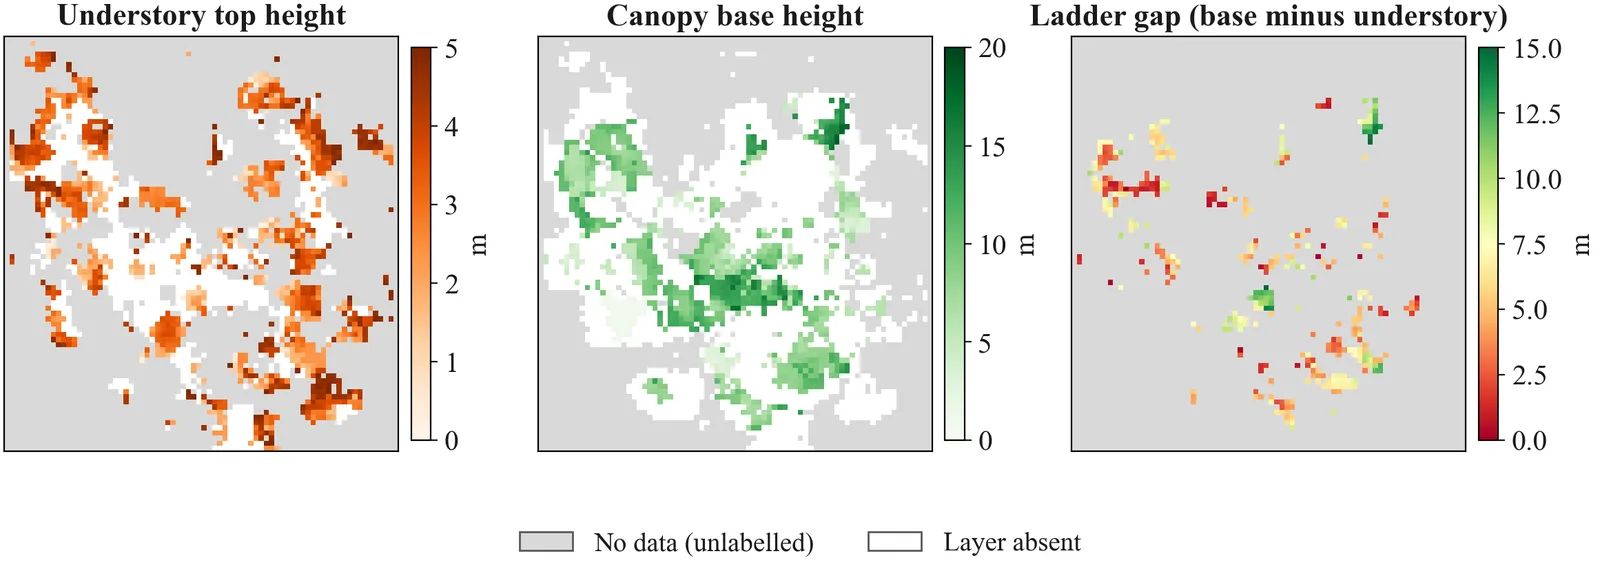 Figure 8. Reference fuel-structure maps from WildForest3D: understory top height, canopy base height and the ladder gap (canopy base minus understory top). Small gaps mark places where fire can climb into the crowns.
Credits
Figures 2, 5, 6, 8 and the figure at the top of this page are drawn from public datasets: WildForest3D, FOR-instanceV2, LAUTx and Wytham Woods. Each dataset’s authors, licence and download link are on the Datasets page.
Objectives
- To measure how much of each forest layer survives the data reduction used by current 3D pipelines, and to define a layer-wise way of reporting accuracy.
- To develop an occlusion-aware method that estimates the hidden layer more accurately under a fixed computing budget, compared with standard sampling at equal cost.
- To validate the estimated structure against ground-based laser scans, and to convert it into the fuel measures fire models use.
- To add a reasoning layer that finds poorly measured regions and requests a second look, and to measure its gain over a single pass.